There’s a chapter in Morgan Housel’s book ‘Psychology of Money’ that has had a lasting impact on me: The best story wins.
It’s made an impact because I’ve always considered myself an engineer at heart: someone that lives in data, in cold, factual numbers, divorced from opinions and feelings. But I’ve also recognised that I’ve never remembered and been moved by anything more than a good story.
For the last few years, alongside being a geospatial data scientist I’ve also thought a lot about how to share the work that I do and make it relatable to a broad set of people, especially people who don’t care about data science or don’t even really know what the word ‘geospatial’ means. To the point that I even quit my job as a full-time data scientist to go all in to explain and share what is possible with geospatial data & satellite images.
I’ve seen incredibly technical achievements: we’re taking pictures of the entire world every 6 days, having access to all of this completely for free. We’re on track to map every single building in the world on a monthly basis. We have just released global maps of every single field in the world. We can predict the weather days & weeks in advance and have satellite images so detailed governments are purposefully telling private companies to please stop publishing them to the press.
But at the same time, so much of the way we talk about this stuff is stuck in incredibly dull, corporate speak that nobody actually cares about, all of it exaggerated by large language models that are still mostly terrible at writing anything that actually is interesting to read to any other human.
I’ve been so frustrated about this that I did quit my job to go all in to tell stories about geospatial data & satellite images because I deeply believe it’s important; especially when many of the projects I just mentioned above are publicly funded. Taxpayers around the world across many countries are financing the very projects that are so valuable yet so few actually end up understanding.
I think the core part of what we’ve been missing is good stories. That’s how we then get to hide the vegetables: the data and science as part of a story that interests people.
Like many things this isn’t new by the way: in the 1660s, Jean de la Fontaine wrote short stories about animals as metaphors for life lessons like humility, preparedness and kindness (they’re so relatable we still talk about these 400y later). A turtle and a hare are a much more effective way of communicating the value of modesty and perseverance than some grand lecture about the values of moral.
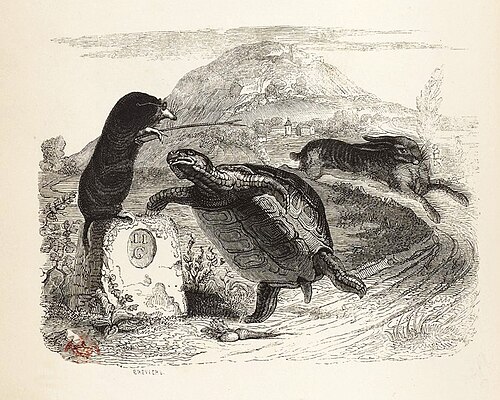
De La Fontaine already hiding the moral vegetables in a good story before it was cool
A couple of years ago I made another lengthy deep dive into how the Flight Simulator franchise has been built over the decades, how every game was reaching for as real a reconstruction of the real world as possible. Because these games are simulators, and at some point to make a good flight simulator you pretty much have to recreate the entire world. So, I made the case that Microsoft ‘accidentally’ has been making the most detailed map out there.
This video is a love letter to the engineering of how these worlds have been built from the original on an Apple II computer to the latest games having to stream the world to you as you fly since there’s so much data to move around.
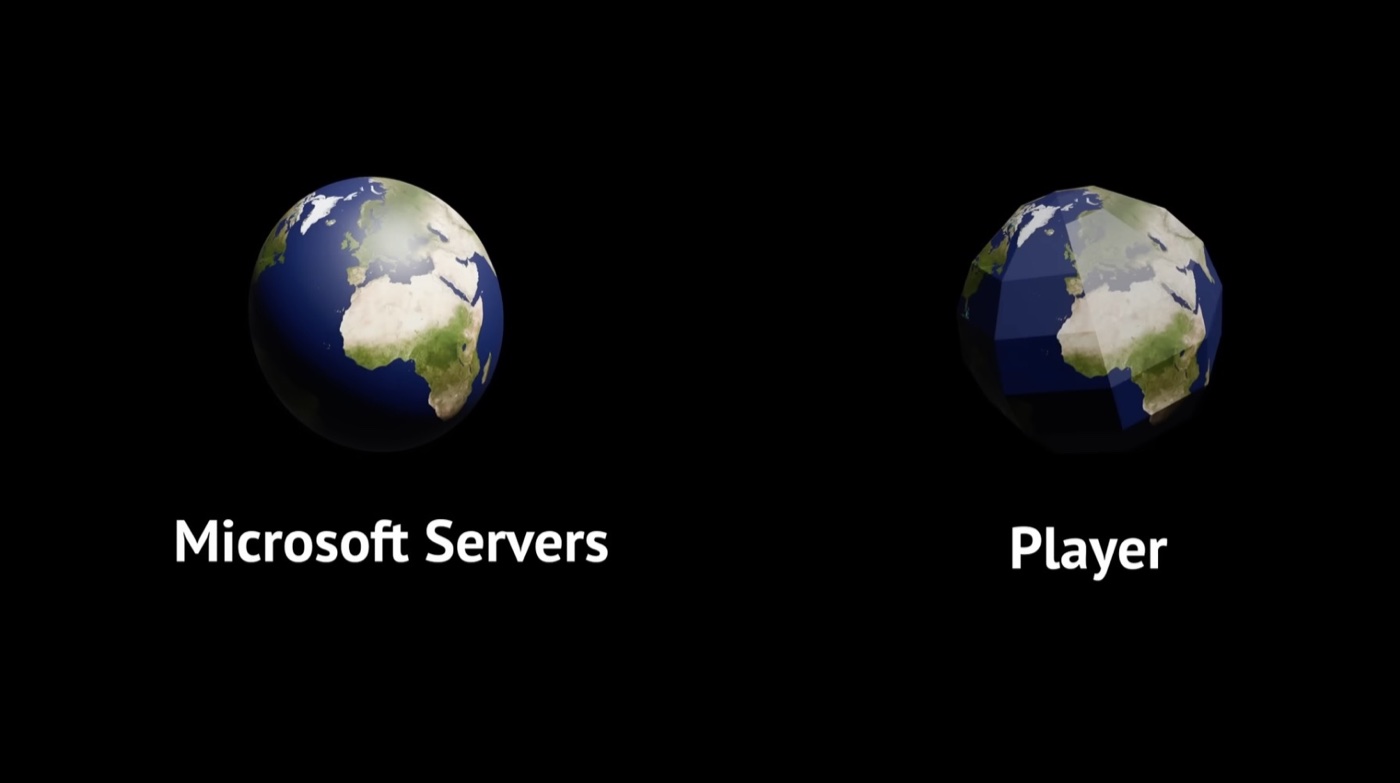
Flight Simulator 2020 in a nutshell
That video has been seen by over half a million people by now; it’s the most viewed thing I’ve ever created in my life and I’d like to think it showed how geospatial data science worked to a whole new audience that may never have cared before.
This brings us to the most controversial video game series in history: Grand Theft Auto.
Controversy that is also, it turns out, a big story that’s mainly been pushed to (and you’ll never believe this) sell more games. Because there’s no better way to get people to talk about your stuff than telling everyone how dangerous it is.
Best story wins.
My goal is not in fact to sell you more games. I’d like to believe I’m in the business of selling excitement, awe and inspiration for our world.
The latest game in the franchise, GTA VI, is about to come out in a few weeks, it’s probably the most anticipated video game of the last 10 years, the only game as anticipated before that is probably the previous game of the franchise. What is interesting to me in these games is that they aren’t doing what Microsoft is trying to do with the Flight Simulator series. Rockstar, the developer behind GTA, is recreating the best parodies of real places.
These games are heavily inspired mainly by New York City, Miami and San Francisco, but are purposefully exaggerated versions of those places. So as a nerdy geospatial data science guy there’s an interesting question now: Well just how real are those maps then?
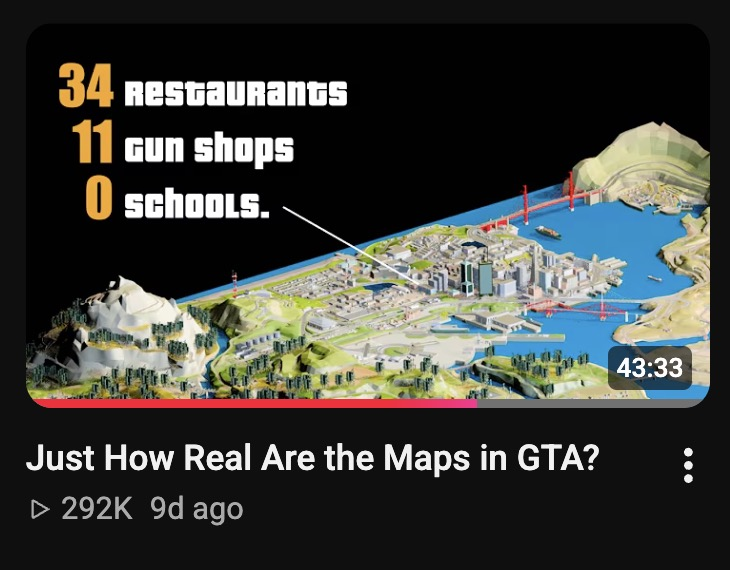
Actually a nerdy video about geospatial data
That’s what my latest video was about: pulling as much data from the original game files and comparing that to real-world data to then estimate the population of the in-game cities, compare their elevation and road morphology to the real places, compare how the path of the sun and the moon differ.
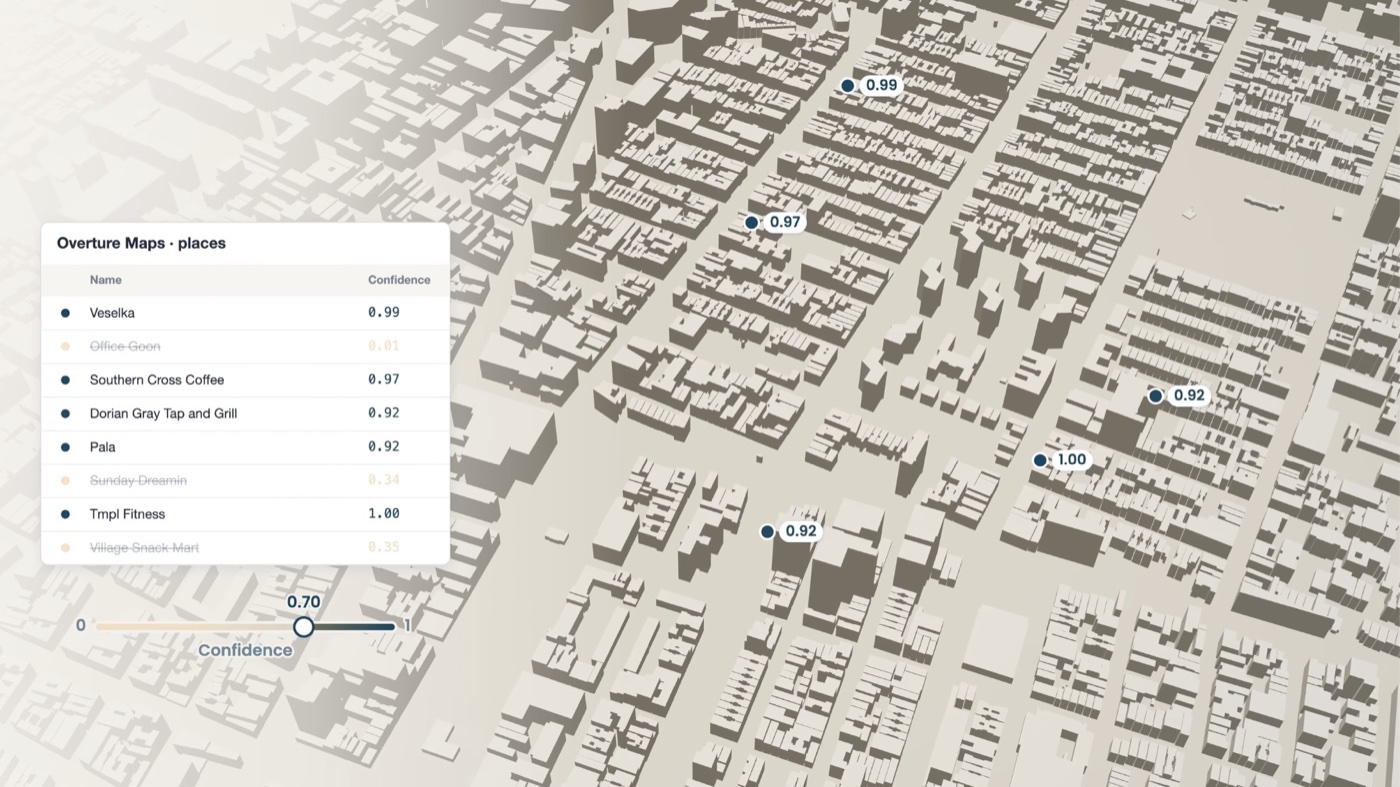
I ended up talking about Overture Maps place datasets, Copernicus’ 30m Digital Elevation Model, USGS lidar data and OpenStreetMap points to an audience of hundreds of thousands of people who would probably never have heard about this, because of a compelling story.
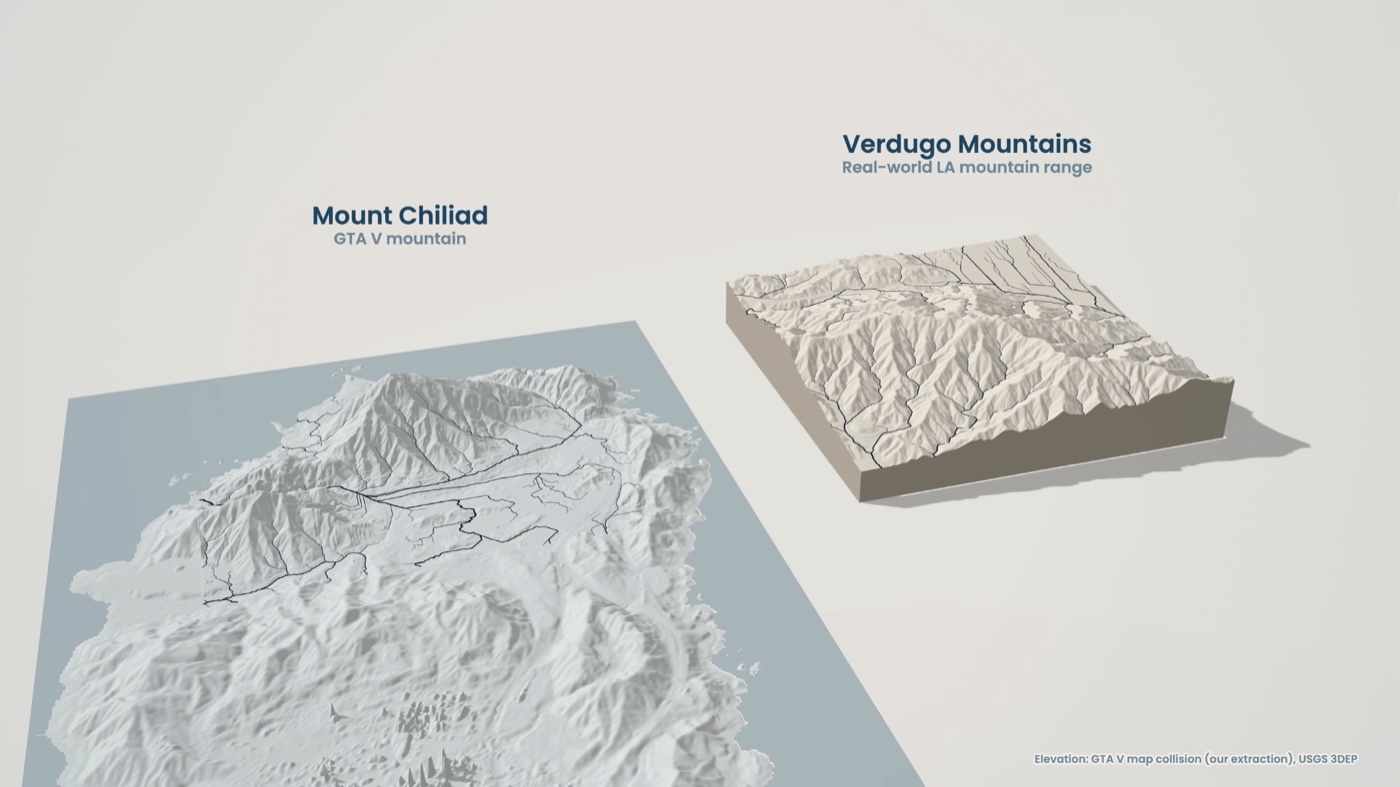
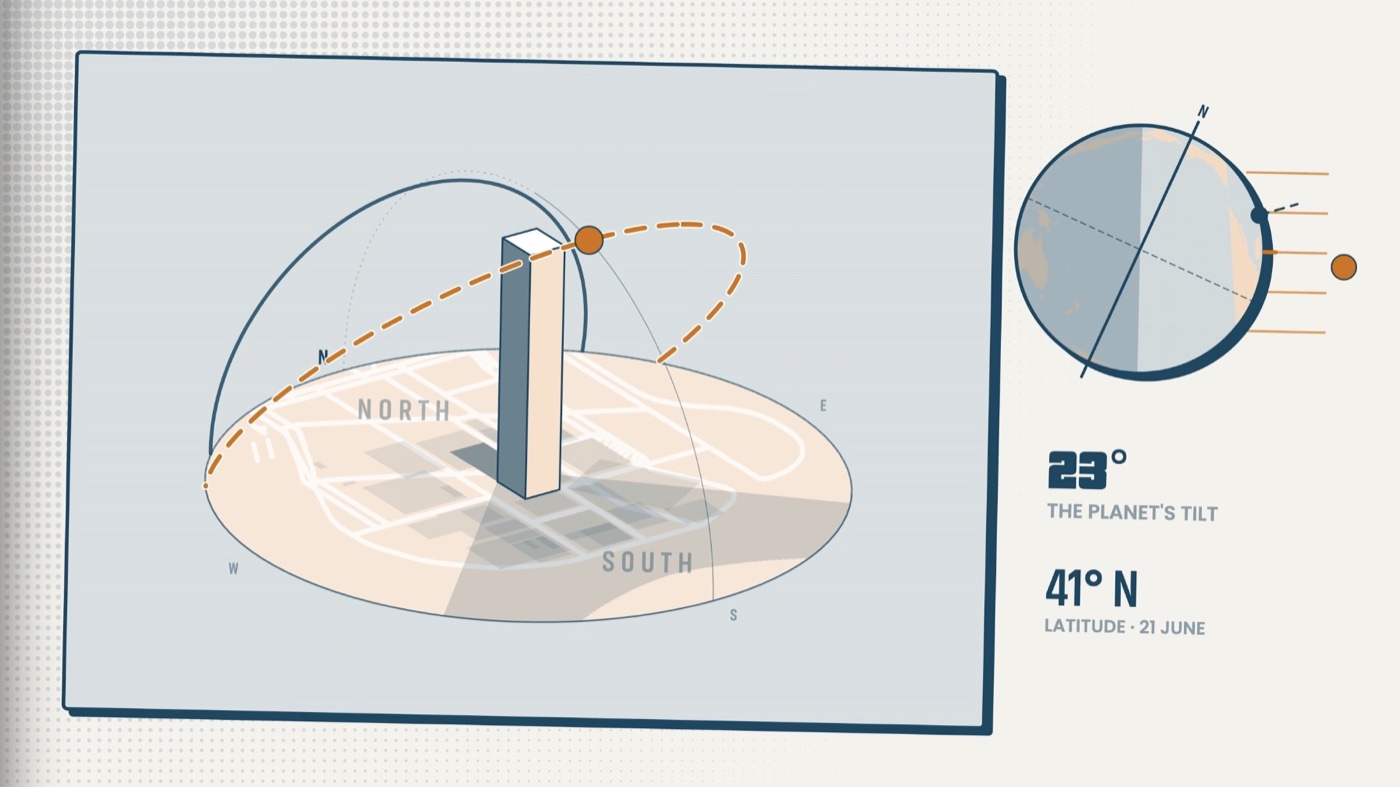
I believe this is about much more than nerdy videos about estimated populations in a top-down video game from the 90s or mapping the path of the sun. Trust in scientific and governmental institutions is falling across the globe. I think a part of this is also because a lot of the science and tech communities can feel so incredibly out of touch and elitist in their ways of talking, where technical lingo is used as a way to make topics feel more complicated and out of reach than they should be. At times I feel like we’re still preachers telling our people they can’t possibly access the Bible themselves because they can’t read and it’s all written in Latin anyways so they should really just trust us to tell them what’s what.
That’s what I took away from Morgan Housel’s chapter: we really need to tell better stories to get people to care about our stuff. Only then do we have something we hide the vegetables in. But we should never assume people will care about these vegetables in the first place. Especially in a world where people have so much more to look at than ever before.
In the time since I left my job as a full-time data scientist I’ve been able to make this video and start working with great institutions to help explain the technical work they’re doing. That’s what I’m working towards doing: Half my time split between helping companies and non-profits share and explain their work, and the other half telling stories just because they’re great stories I just cannot help but want to tell.
If you’re working with geospatial data and want some help sharing it to the world, let’s talk. I’m on Twitter / X, LinkedIn and reachable by email at maxime (at) mindsbehindmaps (dot) com . If you’re more interested in that second half and want to hear good stories, subscribe on YouTube.